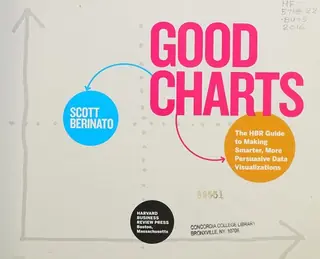
好图表
Good charts
Scott Berinato · 初版 2016 年
1人推荐
2位读者提及
2次提及
“一份优秀的视觉化图表,能够比任何其他沟通形式都更有力地传达思想的本质与潜在影响力。长期以来,“dataviz”一直被视为数据科学家和专业设计师等专家的专属领域。如今不再如此。新一代工具和海量可用数据,让任何人都能轻松创建出远比普通电子表格图表更具表现力的思想视觉化作品。此外,制作精良图表正迅速成为管理者的一项必备技能——如果你不掌握,其他管理者就会迎头赶上并脱颖而出……”
Hacker News 上怎么说
正在加载完整评论……
因为工作需要,我最近一直在学这方面的东西。我发现《Good Charts: The HBR Guide to making Smarter More Persuasive Data Visualizations》[1] 很有帮助。另外《华尔街日报信息图表指南》[2] 也是一本很不错的图表“配方书”。1. https://www.amazon.com/Good-Charts-Smarter-Persuasive-Visual... 2.…
I've been learning this stuff for work some. I've found that Good Charts: The HBR Guide to making Smarter More Persuasive Data Visualizations[1] to be helpful. Also the Wall Street Guide to Info Graphics[2] is a good 'recipe' book for graphs/charts. 1. https://www.amazon.com/Good-Charts-Smarter-Persuasive-Visual... 2.…
我正在读《Good Charts》这本书(https://hbr.org/product/good-charts-the-hbr-guide-to-making-...),里面提到了(并且给出了链接)你的论文。我觉得非常有意思,所以就分享到这里来了,看看其他人是不是也感兴趣。
I'm reading the book Good Charts (https://hbr.org/product/good-charts-the-hbr-guide-to-making-...) and it talked about (and linked) your paper. I found it quite interesting, so I submitted it here in case others did as well.