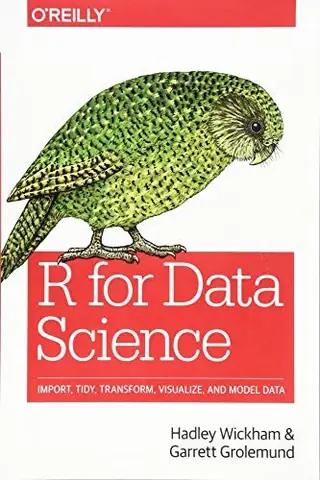
R 数据科学
R for Data Science
Hadley Wickham、Garrett Grolemund · 初版 2017 年
40人推荐
43位读者提及
56次提及
为什么值得读
- 由tidyverse作者亲笔撰写
- 全面系统地介绍现代R语言与核心包
- 让使用R语言分析数据的体验更加顺畅
Hacker News 上怎么说
正在加载完整评论……
R for Data Science
Hadley Wickham、Garrett Grolemund · 初版 2017 年
正在加载完整评论……
Hadley Wickham 是 ggplot2 的作者。他的在线书《R for Data Science》有一章专门讲可视化,除了是一篇很棒的 ggplot2 入门教程外,它恰好也是对其设计理念(图形语法,grammar of graphics)最言简意赅的阐述。
Hadley Wickham is the creator of ggplot2. His online book R for Data Science has a chapter on visualization which, besides being a good tutorial on using ggplot2, happens to be the most concise explanation of the theory that informs its design (the grammar of graphics).
Hadley Wickham(tidyverse 的创造者,我相信他是 R Studio 的首席数据科学家)写的《R 数据科学》(R for Data Science)一书,无疑是数据探索和分析的最佳入门之一。
The “R for Data Science” book by Hadley Wickham (creator of tidyverse, and I believe he is chief data scientist at R Studio) is hands down one of the best introductions to data exploration and analysis.
我个人最喜欢的资源是 Hadley Wickham 的《R 数据科学》(R for Data Science)。它涵盖了许多不错的数据操作和可视化示例,并很好地介绍了 tidyverse,这是 R 的一种特定方言,非常适合数据……
My personal favorite resource is "R for Data Science" by Hadley Wickham. It covers lots of nice data manipulation and visualization examples, and provides a good introduction to the tidyverse, which is a particular dialect of R that's well-suited for data…
所有教程都涉及使用 base R 包。虽然作为教程还可以,但这在性能和可用性上都不能反映真实世界的数据分析,这是我吃过苦头才学到的教训。(在大学用了三个学期后,我沮丧得几乎完全放弃 R) 我建议直接使用 Hadleyverse 包来应对常见用例,并阅读其小插图……
All the tutorials involve using base R packages. While OK for a tutorial, this is not reflective for real-world data analysis both in performance and usability, a lesson I have learned the hard way. (After using it for three semesters in college, I almost quit R completely in frustration) I recommend going straight to the Hadleyverse packages for the common use cases, and read the vignettes for t
一个微不足道的自私问题:有没有库可以生成这里(13.2 nycflights13)的表关系图 http://r4ds.had.co.nz/relational-data.html 当然,感谢又一本好书,它对学习 R 很有帮助,但我总是被你解释一般概念(例如关系数据和连接)的透彻程度所启发。听过几位教员说……
Trivial, self-serving question: is there a library for generating the diagram of table relationships here (13.2 nycflights13) http://r4ds.had.co.nz/relational-data.html And of course, thanks for another great book, it's helpful for learning R but I'm always enlightened by how thoroughly you explain the general concepts (e.g. Relational data and joins). Have heard a few people on faculty speak en
这些教程来自 2014 年。虽然它们很好地概述了 R 语法,但 R 生态已经添加了很多东西,比如 dplyr,作者昨天在他的特朗普推文博客文章中主要使用了它。 如果你有兴趣学习 R,你可能想读 dplyr(和 ggplot2)作者 Hadley Wickham 的《R 数据科学》(R for Data Science)一书(http://r4ds.had.co.nz/)。 相关地,我有自己的(略微……
These tutorials are from 2014. While they provide a good overview of R syntax, a lot has been added to the R-verse such as dplyr, which the author primarily used for his Trump Tweets blog post yesterday. If you are interested in learning R, you may want to read the R for Data Science book (http://r4ds.had.co.nz/) book by dplyr (and ggplot2) author Hadley Wickham. Relatedly, I have my own (slight