……《Grammar of Graphics》http://www.amazon.com/Grammar-Graphics-Leland-Wilkinson/dp/0... 也非常棒,并且已经在 R 语言/统计包中被完整实现了(http://www.amazon.com/ggplot2-Elegant-Graphics-Data-Analysis...)
…Grammar of Graphics" http://www.amazon.com/Grammar-Graphics-Leland-Wilkinson/dp/0... is also excellent and fully implemented in the R programming language/statistics package ( http://www.amazon.com/ggplot2-Elegant-Graphics-Data-Analysis... )
如果你想找些优秀的参考资料来做“数据可视化叙事(visual stories)”,我建议你研究一下 R 的扩展包“ggplot2”[1]。用它来绘制你想要创建的几乎所有类型的图表都是极好的途径(虽然刚上手时会稍微有点挑战)。该 package 的作者还写了一本极棒的书……
If you're interested in good references for being able to produce `visual stories' I suggest you have a look into the R package `ggplot2' [1]. It's a great way (although a little challenging at first) of being able to produce almost all of the types of plots you're interested in creating. The author of the package also wrote a great book…
One of the best all-around plotting packages for R (in my opinion) is Hadley Wickham's ggplot2 . Take a look at the following pages: http://had.co.nz/ggplot2/scale_datetime.html http://had.co.nz/ggplot2/geom_line.html While not specifically inentended as a 'time-series' package, ggplot2's facilities…
……调整。一旦你掌握了门道,光凭对图层(layers)的理解就能很轻松地创建出新的图表。在 matplotlib 甚至 Seaborn 里面,我发现自己总得不停地 Google 找代码示例。ggplot2 绝对是数据可视化领域里出现的最美妙的事物![1] Wickham, Hadley, and Carson Sievert. "4.4.1 Layers." Ggplot2: Elegant Graphics for Data Analysis. Dordrecht: Springer, 2016. N. pag.…
…adjustment Once you get a hang of this, it becomes easy to create new plots purely from the understanding of the layers. In matplotlib or even in Seaborn, I find myself constantly Googling for examples. ggplot2 is the most beautiful thing to happen in visualization space! [1] Wickham, Hadley, and Carson Sievert. "4.4.1 Layers." Ggplot2: Elegant Graphics for Data Analysis. Dordrecht: Springer, 2016. N. pag.…
…gg- in the name; see section 1.3 of [1], and [2,3]) for very fast and convenient interactive plotting, whereas matplotlib is just a clone of MATLIB's procedural plotting API. [1] http://www.amazon.com/ggplot2-Elegant-Graphics-Data-Analysis... [2] http://www.amazon.com/The-Grammar-Graphics-Statistics-Comput... [3] http://vita.had.co.nz/papers/layered-grammar.html
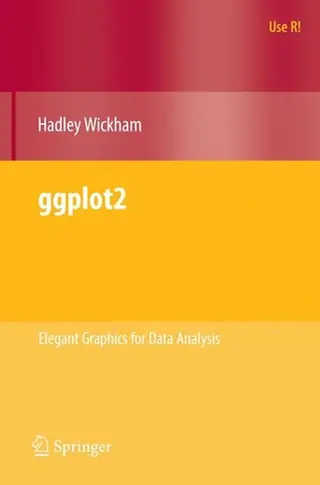
……《Grammar of Graphics》http://www.amazon.com/Grammar-Graphics-Leland-Wilkinson/dp/0... 也非常棒,并且已经在 R 语言/统计包中被完整实现了(http://www.amazon.com/ggplot2-Elegant-Graphics-Data-Analysis...)
…Grammar of Graphics" http://www.amazon.com/Grammar-Graphics-Leland-Wilkinson/dp/0... is also excellent and fully implemented in the R programming language/statistics package ( http://www.amazon.com/ggplot2-Elegant-Graphics-Data-Analysis... )
如果你想找些优秀的参考资料来做“数据可视化叙事(visual stories)”,我建议你研究一下 R 的扩展包“ggplot2”[1]。用它来绘制你想要创建的几乎所有类型的图表都是极好的途径(虽然刚上手时会稍微有点挑战)。该 package 的作者还写了一本极棒的书……
If you're interested in good references for being able to produce `visual stories' I suggest you have a look into the R package `ggplot2' [1]. It's a great way (although a little challenging at first) of being able to produce almost all of the types of plots you're interested in creating. The author of the package also wrote a great book…
GGplot2,作者是 H Wickham http://had.co.nz/ggplot2/ 以及湾区用户组 http://www.meetup.com/R-Users/calendar/10446894/
GGplot2, by H Wickham http://had.co.nz/ggplot2/ and the bay Area user's group http://www.meetup.com/R-Users/calendar/10446894/
在我看来,R 里面综合表现最棒的绘图 package 之一就是 Hadley Wickham 的 ggplot2。可以看看这几个页面:http://had.co.nz/ggplot2/scale_datetime.html http://had.co.nz/ggplot2/geom_line.html 虽说不是专门拿来当“时间序列”package 用的,但 ggplot2 的功能……
One of the best all-around plotting packages for R (in my opinion) is Hadley Wickham's ggplot2 . Take a look at the following pages: http://had.co.nz/ggplot2/scale_datetime.html http://had.co.nz/ggplot2/geom_line.html While not specifically inentended as a 'time-series' package, ggplot2's facilities…
……调整。一旦你掌握了门道,光凭对图层(layers)的理解就能很轻松地创建出新的图表。在 matplotlib 甚至 Seaborn 里面,我发现自己总得不停地 Google 找代码示例。ggplot2 绝对是数据可视化领域里出现的最美妙的事物![1] Wickham, Hadley, and Carson Sievert. "4.4.1 Layers." Ggplot2: Elegant Graphics for Data Analysis. Dordrecht: Springer, 2016. N. pag.…
…adjustment Once you get a hang of this, it becomes easy to create new plots purely from the understanding of the layers. In matplotlib or even in Seaborn, I find myself constantly Googling for examples. ggplot2 is the most beautiful thing to happen in visualization space! [1] Wickham, Hadley, and Carson Sievert. "4.4.1 Layers." Ggplot2: Elegant Graphics for Data Analysis. Dordrecht: Springer, 2016. N. pag.…
……名字里的 gg-;参见 [1] 的第 1.3 节,以及 [2,3])来实现极快且方便的交互式绘图,而 matplotlib 只不过是 MATLAB 那套过程式绘图 API 的翻版罢了。[1] http://www.amazon.com/ggplot2-Elegant-Graphics-Data-Analysis... [2] http://www.amazon.com/The-Grammar-Graphics-Statistics-Comput... [3] http://vita.had.co.nz/papers/layered-grammar.html
…gg- in the name; see section 1.3 of [1], and [2,3]) for very fast and convenient interactive plotting, whereas matplotlib is just a clone of MATLIB's procedural plotting API. [1] http://www.amazon.com/ggplot2-Elegant-Graphics-Data-Analysis... [2] http://www.amazon.com/The-Grammar-Graphics-Statistics-Comput... [3] http://vita.had.co.nz/papers/layered-grammar.html